Imagine a global shipping company navigating a sudden storm in a busy sea lane. The captain who relies solely on past experience might make a costly detour. In contrast, the captain using real-time weather data, port congestion analytics, and predictive fuel consumption models can chart a course that saves time and resources. The difference isn’t intuition; it’s the strategic application of information.
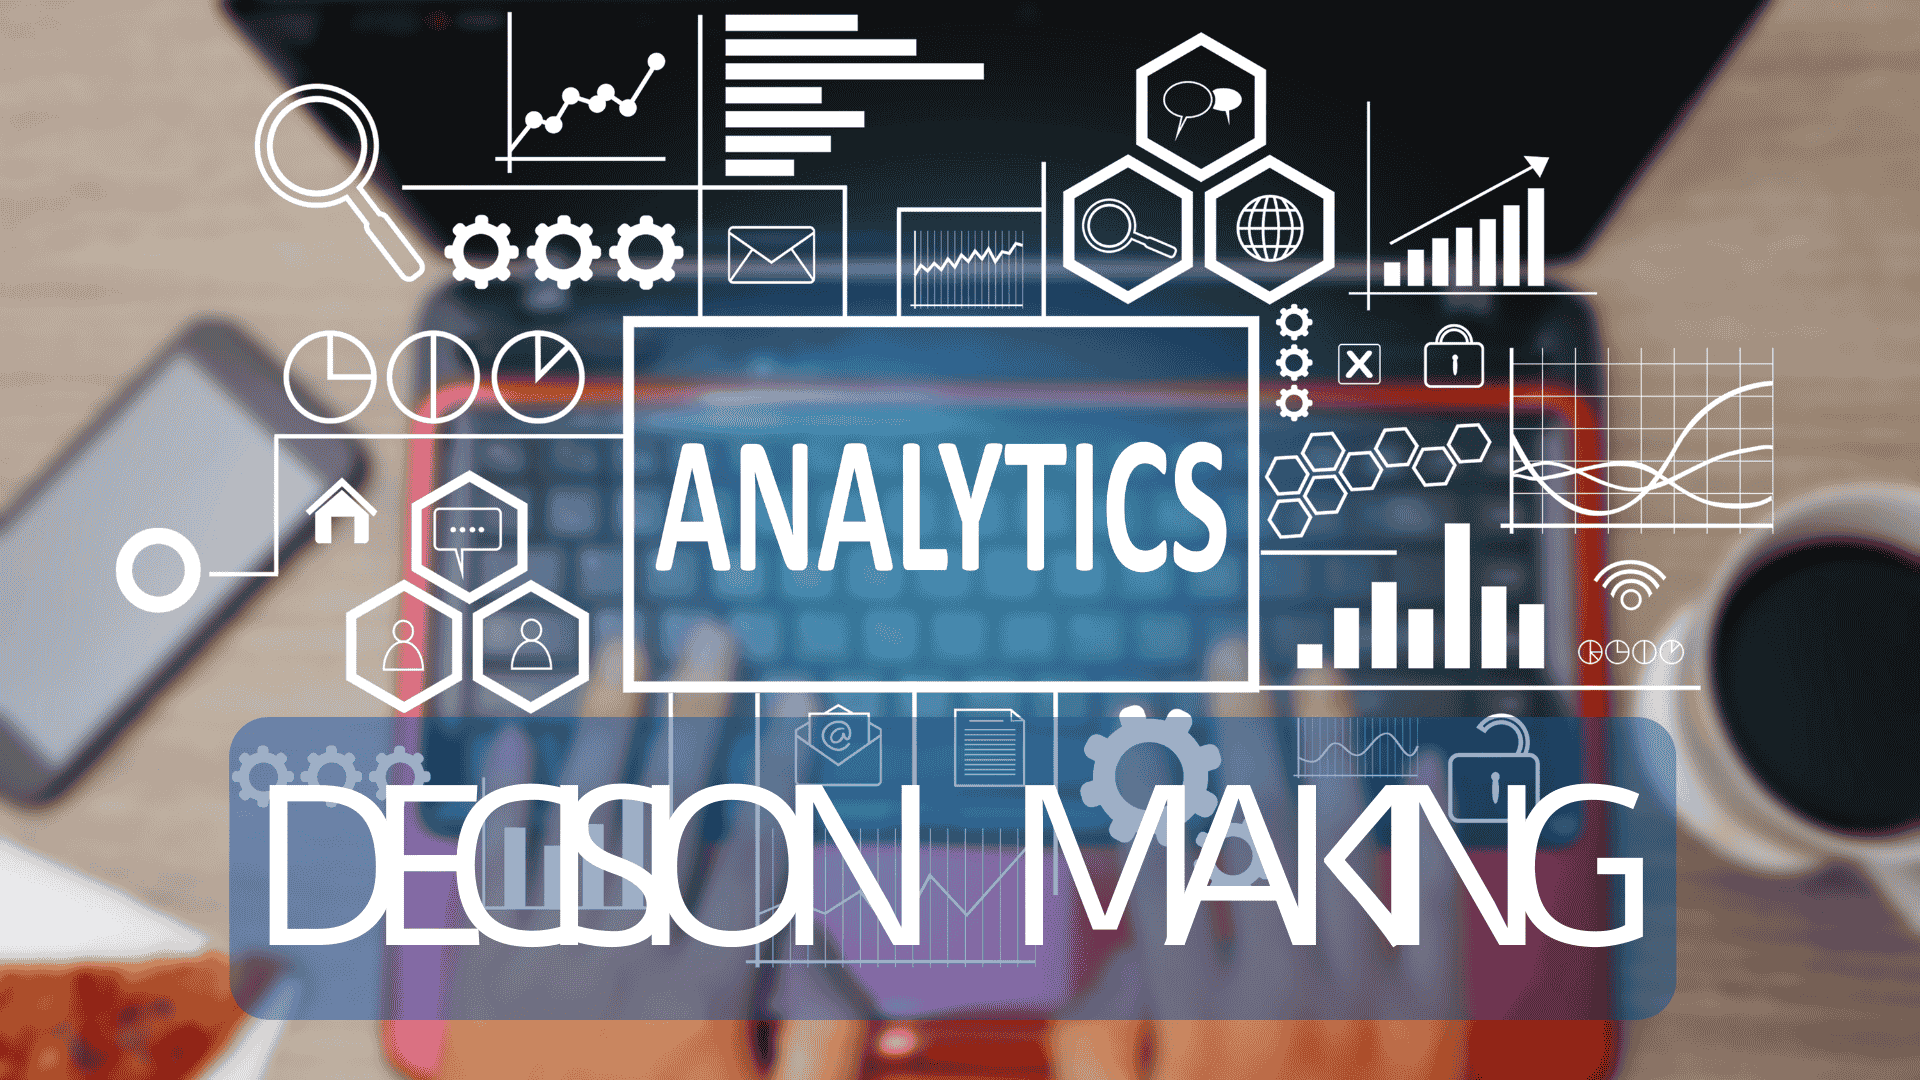
This is the core of data analytics for business decision making. It’s the formal process of transforming raw numbers into a clear roadmap for your organization’s future. This guide will not just tell you what it is; it will show you how to do it. We will provide you with a practical framework you can begin applying immediately to move from reactive choices to proactive, data-informed strategies.
1. The Foundation: How to Define Your Business Questions
Before you can find answers, you must ask the right questions. Data without a purpose is just noise. The most critical step is to translate your business objectives into specific, answerable queries.
1.1. Moving from Vague to Specific
Many leaders start with broad goals like “we need to improve operational efficiency.” This is too vague for data analysis. You need to drill down. A helpful technique is to ask “why” multiple times until you reach a core issue.
For example:
- Vague Goal: “Improve operational efficiency.”
- 1st ‘Why?’: “Because our production line is experiencing delays.”
- 2nd ‘Why?’: “Because a specific machine, Machine B, frequently stops.”
- 3rd ‘Why?’: “Because its failure rate increases after 100 hours of continuous operation.”
Now you have a specific, measurable question: “What is the optimal maintenance schedule for Machine B to minimize downtime without over-investing in servicing?” This question gives your data analysis a clear target.
1.2. Identifying Key Performance Indicators (KPIs)
Once you have your question, identify the metrics that will answer it. For our Machine B example, your KPIs would be:
- Machine uptime percentage.
- Mean Time Between Failures (MTBF).
- Cost of maintenance per operational hour.
- Production output per shift.
These KPIs are the signposts that tell you if your decisions are leading you toward your goal.
2. The Raw Material: How to Gather Relevant and Clean Data
With a clear question and defined KPIs, you can now collect the necessary information. High-quality decisions depend entirely on high-quality data.
2.1. Locating Your Data Sources
Data can come from numerous places, both inside and outside your organization.
- Internal Sources: This is data your business generates daily. Examples include Customer Relationship Management (CRM) systems, inventory management logs, sales records from Q1 2025, and machine sensor readings.
- External Sources: This is data from outside your company that provides broader context. Examples include industry benchmark reports, supply chain partner data, public demographic information, and commodity market trends.
The key is to gather data that directly relates to your KPIs. For our manufacturing problem, you’d need sensor data from Machine B, maintenance logs, and output records.
2.2. The Unseen Hurdle: Ensuring Data Quality
This is where many initiatives falter. Raw data is often messy, incomplete, or inconsistent. This “data cleaning” or “data preparation” phase is essential. How do you do it?
- Standardize Formats: Ensure dates are all in the same format (e.g., DD-MM-YYYY).
- Remove Duplicates: Delete any repeated entries that could skew your analysis.
- Address Missing Values: Develop a consistent strategy for handling gaps. You might fill them with an average value or remove the incomplete record, depending on the context.
- Validate Accuracy: Cross-reference data with other sources where possible to ensure it reflects reality.
A clean dataset is the bedrock upon which all reliable insights are built.
3. The Analysis Phase: How to Transform Data into Insights
With clean data in hand, the analysis can begin. This is where you uncover patterns, correlations, and trends that were previously hidden. For managers, it’s helpful to understand the four primary types of data analytics.
3.1. Choosing the Right Type of Analysis
Each type of analysis answers a different kind of question, building upon the last.
- Descriptive Analytics (What happened?): This is the most common form of analysis. It summarizes past data to understand what has occurred. How to apply it: Create a dashboard showing Machine B’s uptime over the past six months. This gives you a clear, historical view of the problem.
- Diagnostic Analytics (Why did it happen?): This involves digging deeper to find the root cause of an outcome. How to apply it: Correlate the downtime data with other variables, such as the shift supervisor, the raw material batch used, or ambient factory temperature. You might discover that failures are 35% more likely when a specific, lower-grade lubricant is used.
- Predictive Analytics (What will happen next?): This uses statistical models and historical data to forecast future outcomes. How to apply it: Build a model that predicts the probability of Machine B failing in the next 24 hours based on its current operational temperature and vibration levels.
- Prescriptive Analytics (What should we do?): This is the most advanced stage, recommending specific actions to achieve a desired outcome. How to apply it: The system could use the predictive model to automatically generate a maintenance alert, advising a technician to service Machine B before it fails, and suggesting the optimal time to do so to minimize production disruption.
3.2. A Practical Example: A Short Story
Anya manages GreenSprout Farms, a large agricultural enterprise. The management team had a vague goal: “increase crop yield.” Applying a data-driven approach, Anya reframed the question: “Which irrigation method provides the optimal balance of water usage and corn yield in our largest field, Field A?“
First, she gathered data from soil moisture sensors, weather station feeds, and historical yield records for the past three years. After cleaning the data to remove anomalies from a year with a broken sensor, she performed her analysis.
- Descriptive analysis showed that yields in Field A were consistently 10% lower than in other fields.
- Diagnostic analysis correlated this lower yield with a specific irrigation schedule that was causing underwatering during critical growth periods in the afternoon.
- Using this insight, she ran a predictive model to forecast the yield if the irrigation schedule were changed. The model predicted a 12-15% increase in yield.
- Finally, prescriptive analytics recommended a new, dynamic irrigation schedule that adjusted based on real-time soil moisture readings.
Anya presented this data, not an opinion, to her team. They implemented the new schedule. By the end of the next harvest, the yield from Field A had increased by 14%, and water consumption had decreased by 5%.
4. The Action Plan: How to Implement and Measure Your Decisions
Insights are useless until they are acted upon. The final phase is about turning your analysis into real-world strategy and tracking its impact.
4.1. From Insight to Actionable Strategy
Translate your findings into clear, actionable steps. Based on the analysis of Machine B, the strategy would be:
- Implement a predictive maintenance schedule based on real-time sensor data.
- Discontinue the use of the lower-grade lubricant identified in the diagnostic phase.
- Train technicians to respond to predictive alerts generated by the system.
4.2. Closing the Loop: Monitoring and Iterating
Data analytics for business decision making is not a one-time project; it’s a continuous cycle. After implementing your changes, you must monitor the same KPIs you identified in the first step.
- Is Machine B’s uptime increasing?
- Has the MTBF improved?
- What is the return on investment for the new maintenance program?
You can also use techniques like A/B testing, where you apply a change to one area (e.g., one production line) and compare its performance against an unchanged area. This provides undeniable proof of the impact of your decision. If the results are positive, you scale the solution. If not, you analyze why, adjust your strategy, and test again.
Conclusion
Let’s return to our two shipping companies. The one relying on old methods is still navigating by looking at the wake behind the ship. The company using data analytics is looking ahead, seeing the weather before it arrives, anticipating the currents, and charting a course for success. By moving beyond intuition and embracing a structured process—asking the right questions, gathering clean data, performing insightful analysis, and acting decisively—you equip your organization to not only survive the storm but to sail ahead of the competition. This journey from data to decision is the defining business skill of our time.
Frequently Asked Questions (FAQ)
- 1. What is the most critical first step in data analytics for business?
The most crucial step is not data collection, but clearly defining the specific business question you want to answer. A well-defined question guides your entire analysis and ensures the insights you generate are relevant and actionable. - 2. Do I need to be a data scientist to use data for decisions?
No. While data scientists are essential for building complex models, modern Business Intelligence (BI) software and dashboards are designed for managers. These tools visualize data in an intuitive way, allowing you to identify trends and understand performance without needing to write code. - 3. How can a small business start with data analytics?
Start small and simple. Begin with the data you already have, such as sales records or website traffic. Use widely available tools like spreadsheets to perform basic descriptive analysis. The goal is to build a culture of asking questions and seeking answers in your data, not to implement a massive system overnight. - 4. What is the biggest challenge most businesses face in this process?
The most common and significant challenge is ensuring data quality. Many businesses discover that their data is inconsistent, incomplete, or stored in disconnected systems. Investing time in cleaning and organizing your data is a critical, non-negotiable step for achieving reliable insights.
references
Warning: The provided links lead only to the specified content. Other areas of those sites may contain material that conflicts with some beliefs or ethics. Please view only the intended page. Note: The source links are available in English only.
- Asana July 3, 2025 Data-Driven Decision Making: A Step-by-Step Guide.
A guide on using KPIs and data to make objective business decisions.


